No Cost, Big Rewards: 6 Best Free Forex Indicators for Traders
If you’re new to Forex trading, you might be wondering how traders make decisions about buying and selling different currencies. One tool that traders use to help them make informed decisions is Forex indicators.
What are Forex Indicators?
Forex indicators are mathematical calculations based on the price and/or volume of a currency pair. They help traders analyze and predict the behavior of currency prices. Indicators can be incredibly versatile and used in a variety of ways to provide valuable insights. They can be used to identify trends, measure volatility, determine if a currency is overbought or oversold, and much more.
7 Best Free Forex Indicators for Traders
Click on the link in each paragraph for more detail on each indicator.
1. Moving Average
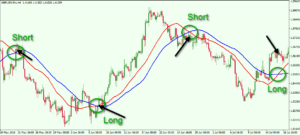 One of the most commonly used indicators is moving average. This indicator is used to identify trends by smoothing out fluctuations in price data. Essentially, it provides a clearer picture of what’s happening in the market by averaging out the highs and lows of a currency pair over a specific period of time. Traders use moving averages to identify the direction of a trend and to help them determine when to enter or exit a trade.
2. Relative Strength Index
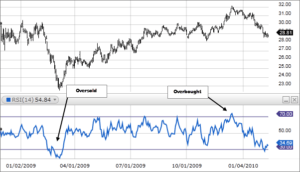 The Relative Strength Index (RSI) is another popular indicator that measures the strength of a currency pair by comparing its recent gains to its recent losses. Traders use the RSI to identify overbought or oversold conditions in the market. When the RSI is above 70, it’s considered overbought, which means the currency may be due for a price correction. Conversely, when the RSI is below 30, it’s considered oversold, which means the currency may be due for a price increase.
3. Stochastic Oscillator
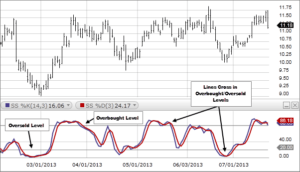 The Stochastic Oscillator is another indicator that helps traders identify overbought and oversold conditions in the market. It works by comparing the closing price of a currency pair to its price range over a specific period of time. The oscillator generates two lines: the %K line and the %D line. When the %K line crosses above the %D line, it’s a bullish signal, and when the %K line crosses below the %D line, it’s a bearish signal.
4. Bolinger Bands
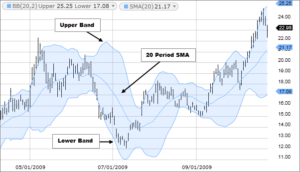 Bollinger Bands are used to measure volatility by plotting bands around a moving average. The bands are based on standard deviations, and they expand and contract based on the volatility of the market. Traders use Bollinger Bands to identify potential breakouts, as well as to determine support and resistance levels.
5. Fibonacci Retracement
 Fibonacci retracement is another popular indicator that helps traders identify potential levels of support and resistance by plotting horizontal lines at the Fibonacci levels of a currency pair’s recent price action. These levels are based on the Fibonacci sequence, a mathematical pattern that appears in nature and in financial markets. Traders use Fibonacci retracements to help them determine where to enter or exit a trade.
6. MACD
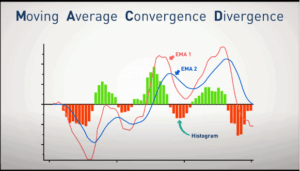 The Moving Average Convergence Divergence (MACD) is an indicator that identifies the momentum of a currency pair by comparing the difference between two moving averages. The MACD generates two lines: the MACD line and the signal line. When the MACD line crosses above the signal line, it’s a bullish signal, and when the MACD line crosses below the signal line, it’s a bearish signal.
Forex Indicators Wrap Up
While Forex indicators can be incredibly helpful, it’s important to remember that they’re not a guarantee of success. They should be used in conjunction with other forms of technical and fundamental analysis. By combining indicators with market knowledge and experience, traders can make more informed decisions about when to enter or exit a trade.
My favourite prop firms:
- Funded Trading Plus (Use Coupon Code DAR10 for 10% off)
- E8 Funding (Use Coupon Code REB8 for 8% off)
- MFF
- FTMO
If you like this post and would like to be notified of new posts, subscribe in the top right of this page. Please rate, share and comment!
