MA and RSI Strategy – Place Winning Trades
Hey traders! Are you looking to improve your trading game? Look no further than Moving Average (MA) and Relative Strength Index (RSI). These two technical indicators are commonly used by traders to help them make informed decisions about when to enter or exit trades. In this blog post, we’ll dive into how MA and RSI can be used together to decide trades.
First, let’s do a quick refresher on what MA and RSI are. MA is a technical indicator that helps identify trends in the market by calculating the average price of an asset over a specific period of time. RSI, on the other hand, is a momentum oscillator that measures the strength of an asset’s price action over a specific period of time.
So, how do these two indicators work together? Let’s take a look at a few scenarios.
Scenario 1: Confirming Trends
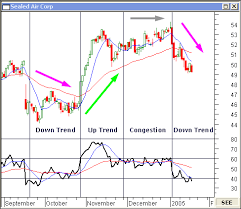
When using MA and RSI together, traders can confirm whether or not a trend is in place. For example, let’s say that an asset is trading above its MA and the  MA is sloping upwards. This indicates a bullish trend. If the RSI is also trending higher, this confirms that the bullish momentum is strong and it may be a good time to enter a long position.
Conversely, if an asset is trading below its MA and the MA is sloping downwards, this indicates a bearish trend. If the RSI is also trending lower, this confirms that the bearish momentum is strong and it may be a good time to enter a short position.
Scenario 2: Identifying Overbought and Oversold Levels
As we mentioned earlier, RSI is a great tool for identifying overbought and oversold conditions in the market. When an asset’s RSI reaches above 70, it’s considered overbought, and when it falls below 30, it’s considered oversold.
 By using MA in conjunction with RSI, traders can confirm whether or not an asset is overbought or oversold. For example, let’s say that an asset’s RSI is above 70 and the price is trading above the MA. This indicates that the asset is likely overbought and due for a pullback. If the RSI is also trending lower, this confirms that the bearish momentum is strong and it may be a good time to exit a long position or even consider entering a short position.
On the other hand, if an asset’s RSI is below 30 and the price is trading below the MA, this indicates that the asset is likely oversold and due for a rebound. If the RSI is also trending higher, this confirms that the bullish momentum is strong and it may be a good time to enter a long position.
Scenario 3: Trading Crossovers
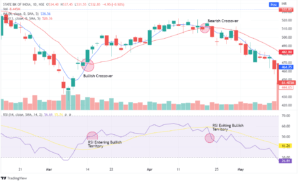
When a shorter-term MA line crosses above a longer-term MA line, this indicates a bullish trend, and when it crosses below, it indicates a bearish  trend. By using MA and RSI together, traders can confirm whether or not a crossover is a good trading opportunity.
For example, let’s say that a shorter-term MA line crosses above a longer-term MA line, indicating a bullish trend. If the RSI is also indicating bullish momentum, this confirms that the crossover is a good signal to enter a long position.
Conversely, if a shorter-term MA line crosses below a longer-term MA line, indicating a bearish trend, and the RSI is also indicating bearish momentum, this confirms that the crossover is a good signal to enter a short position.
Conclusion – MA and RSI
In conclusion, MA and RSI are two technical indicators that traders can use in combination to make informed decisions about when to enter or exit trades. By confirming trends, identifying overbought and oversold levels, and trading crossovers, traders can increase their chances of success and achieve their trading goals. It’s important to remember that no trading strategy is foolproof, and traders should always use proper risk management and have a sound understanding of the assets being traded.
Additionally, it’s important to note that MA and RSI are just two of many technical indicators that traders can use in combination with each other or other strategies. Traders should always be open to exploring new indicators and strategies that work for their trading style and goals.
It’s also worth noting that MA and RSI are best used in conjunction with other analysis, including fundamental analysis and market sentiment analysis. Traders should always consider multiple factors when making trading decisions, rather than relying solely on technical indicators.
My favourite prop firms:
- Funded Trading Plus (Use Coupon Code DAR10 for 10% off)
- E8 Funding (Use Coupon Code REB8 for 8% off)
- MFF
- FTMO
If you like this post and would like to be notified of new posts, subscribe in the top right of this page. Please rate, share and comment!
Check out these articles that fully describe the MA and RSI strategies separately:
Moving Average Demystified: How to Use It for Forex Trading
The RSI Indicator: Tips to Make Better Decisions
Related Posts

Technical Analysis: 4 Stocks with signs of death crossovers to keep an eye on

HDFC Bank & 3 other fundamentally strong stocks trading above 200 DMA to keep an eye on

Falling Channel Breakout: Multibagger NBFC Stock Shows Bullish Momentum on Daily Chart

4 Fundamentally strong stocks to buy for an upside potential of up to 36%; Do you hold any?

