The RSI Indicator: Tips to Make Better Decisions
Are you curious about how traders use the Relative Strength Index (RSI) to make better trading decisions? This technical indicator measures the strength of a market trend by comparing recent gains to recent losses. It’s shown on a scale of 0-100 and can help traders identify when an asset is overbought or oversold.
In this article, I’ll explain how the RSI works, how to calculate it, and different ways traders use it to generate buy and sell signals. If you want to improve your trading skills, keep reading!
RSI: The Basics
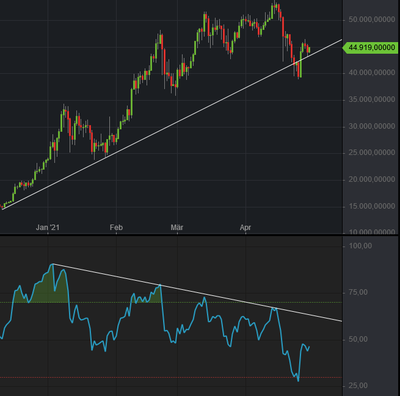
The RSI is plotted on a scale of 0-100 and is typically displayed as a line chart below the price chart. When the RSI value is above 70, it is considered 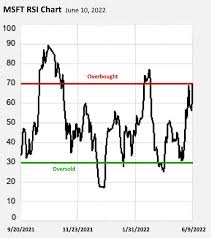 overbought, and when the RSI value is below 30, it is considered oversold. Traders use the RSI to identify potential trend reversals and to generate buy and sell signals.
Calculation of RSI:
The RSI is calculated using the following formula:
RSI = 100 – 100 / (1 + RS)
Where RS = Average gain of up periods during the specified time frame / Average loss of down periods during the specified time frame
To calculate the RSI, traders first choose a time frame, typically 14 periods. They then calculate the average gain and average loss for the specified time frame. The RS is calculated by dividing the average gain by the average loss. The RSI value is then derived from the RS using the above formula.
How to Use the RSI:
The RSI is a versatile indicator that can be used in a variety of ways. Here are a few common ways traders use the RSI:
1. Identify Overbought and Oversold Conditions:
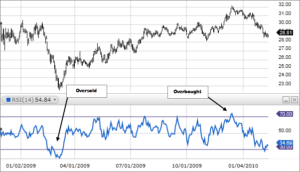 As mentioned earlier, when the RSI value is above 70, it is considered overbought, and when the RSI value is below 30, it is considered oversold. Traders use these levels to identify potential trend reversals.
For example, when the RSI value is above 70, traders may interpret this as an overbought condition and a potential sell signal. Conversely, when the RSI value is below 30, traders may interpret this as an oversold condition and a potential buy signal.
2. Divergence:
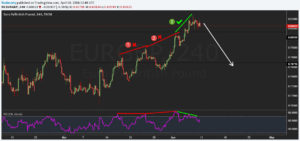 Traders also use the RSI to identify divergence between the RSI line and the price chart. Divergence occurs when the RSI line is moving in the opposite direction of the price chart. This can be a sign that the trend is losing momentum and may be about to reverse.
For example, if the price chart is making higher highs, but the RSI line is making lower highs, this could be a sign that the trend is losing momentum and may be about to reverse.
3. Trend Confirmation:
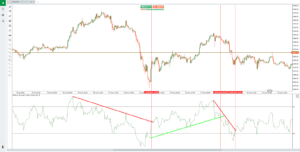 Traders also use the RSI to confirm a trend. If the price chart is making higher highs and the RSI line is also making higher highs, this is a sign that the trend is strong and may continue.
Similarly, if the price chart is making lower lows and the RSI line is also making lower lows, this is a sign that the trend is strong and may continue.
4. Multiple Time Frames:
Traders can also use the RSI across multiple time frames. For example, if the RSI is indicating an oversold condition on a daily chart, but the RSI on a weekly chart is still in an uptrend, this could be a sign that the trend is still intact and the oversold condition on the daily chart may be a buying opportunity.
RSI – Conclusion:
The RSI is a powerful technical indicator that can help traders identify potential trend reversals and generate buy and sell signals. However, like any technical indicator, it should be used in conjunction with other forms of analysis and not relied upon solely. Traders should also be aware of its limitations and use it in combination with other tools and indicators to make informed trading decisions.
My favourite prop firms:
- Funded Trading Plus (Use Coupon Code DAR10 for 10% off)
- E8 Funding (Use Coupon Code REB8 for 8% off)
- MFF
- FTMO
If you like this post and would like to be notified of new posts, subscribe in the top right of this page. Please rate, share and comment!
Want to learn more about trading with both MA and RSI? Check this out: MA and RSI Strategy – Place Winning Trades
https://youtu.be/VH84ppzmq9Q
