Top 9 Candlestick Patterns for Profitable Trading
Candlestick patterns are a powerful tool for traders to analyze price action and make informed decisions about buying and selling securities. They have been used for centuries in Japan and were introduced to the Western world by Steve Nison in the 1990s. Candlestick charts are now widely used by traders of all levels and are an essential tool in technical analysis.
In this article, I’ll explore the basics of candlestick patterns and explain some of the main ones in full. I’ll also provide some tips for using them effectively in your trading strategy.
What are Candlestick Patterns?
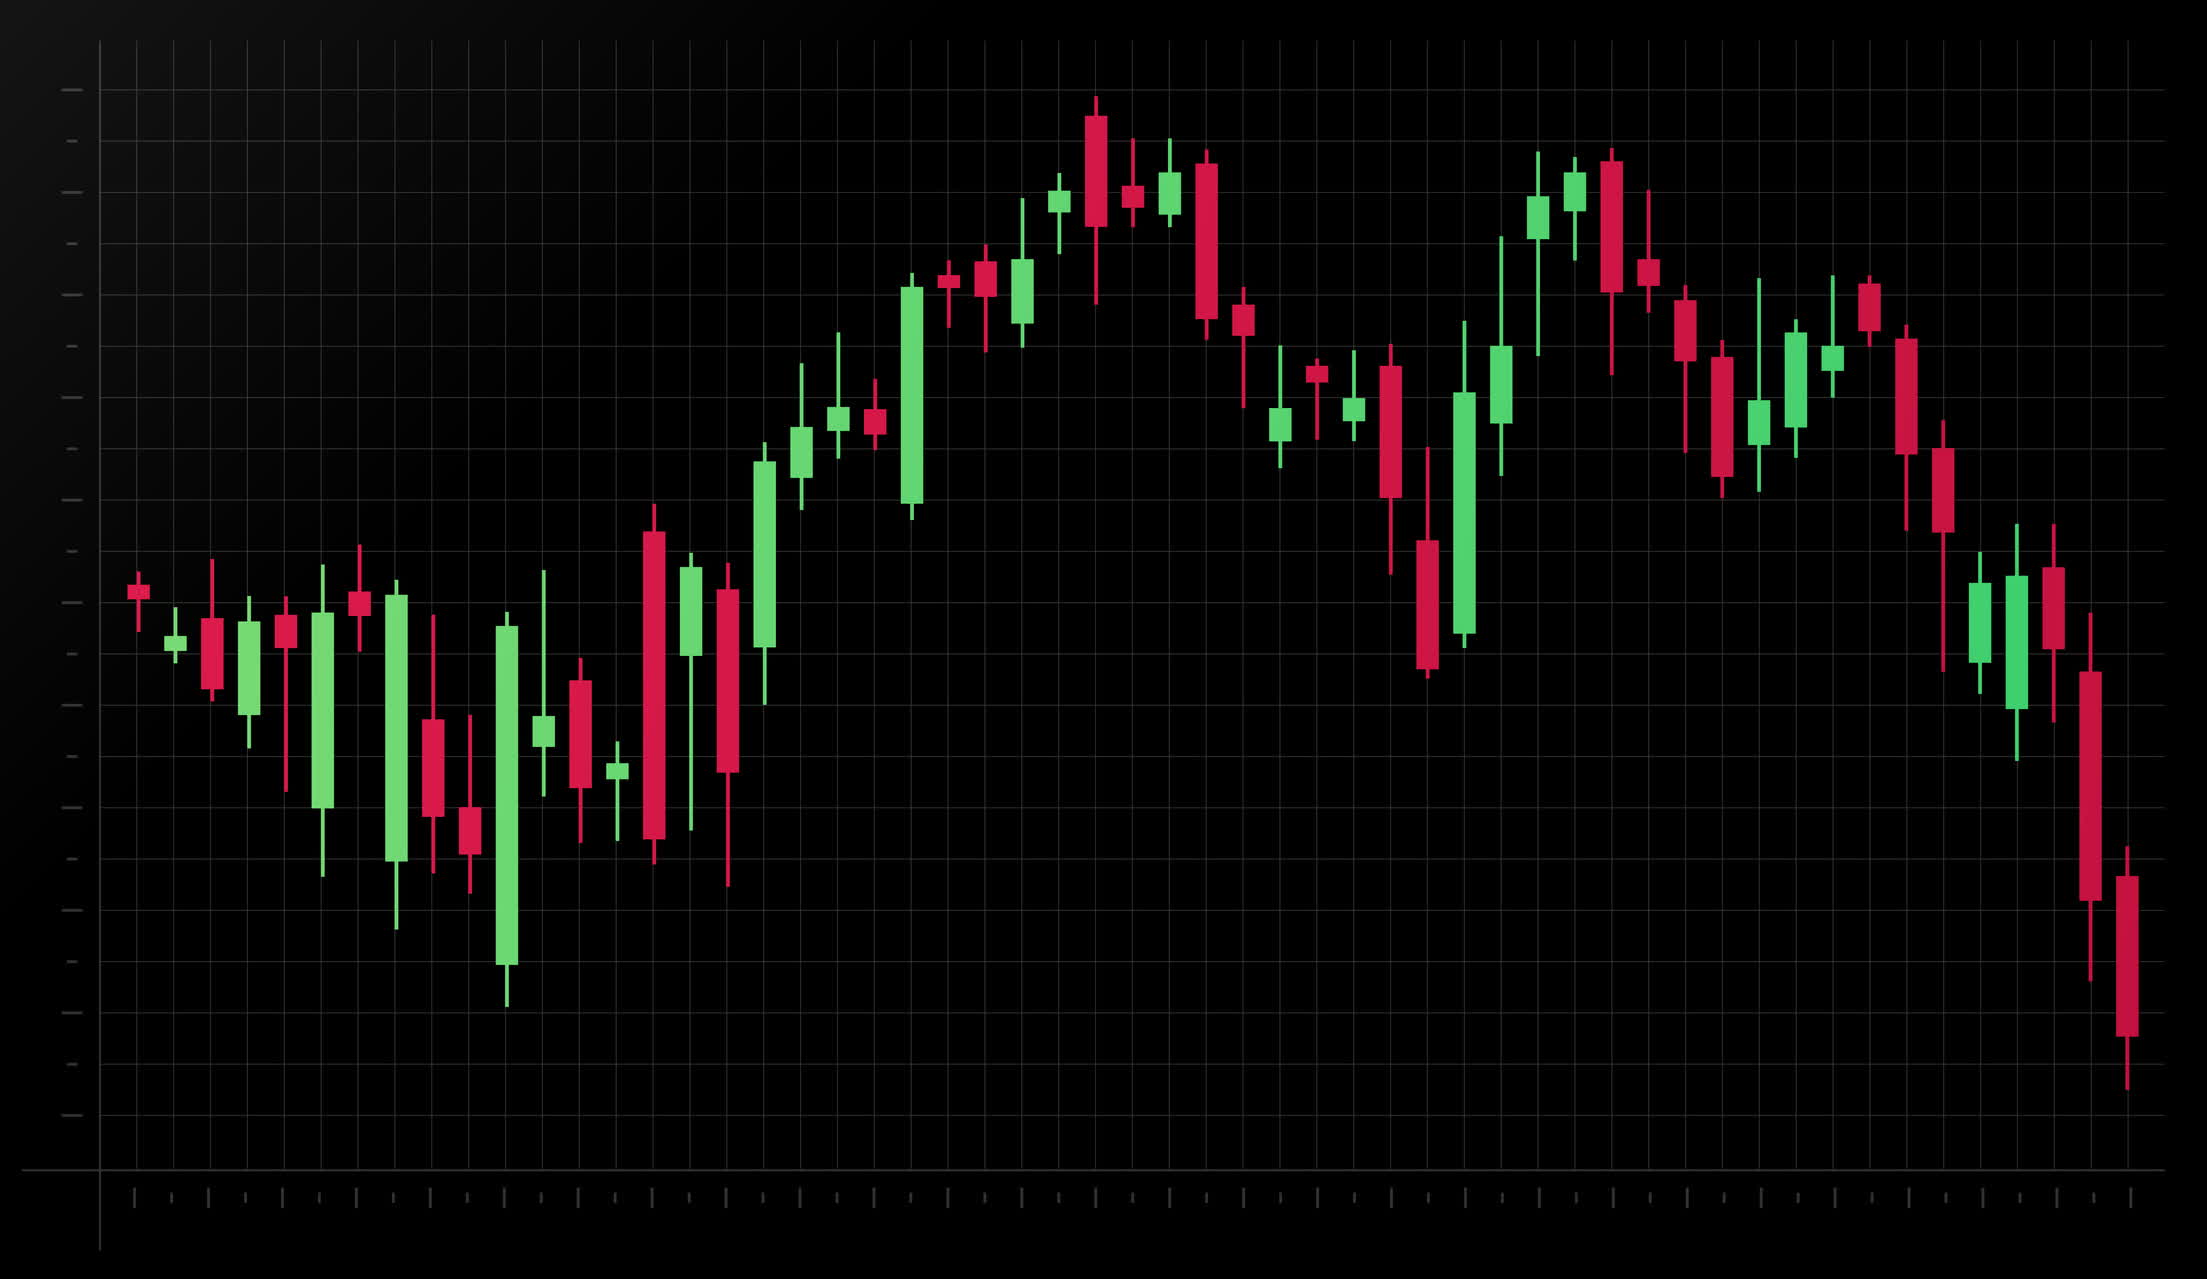
Candlestick charts are a visual representation of price action over a specific time frame. Each candlestick represents a specific period, whether it be 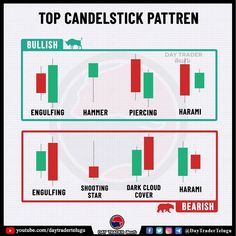 minutes, hours, days, or weeks, depending on the timeframe you’re analyzing. The candlestick is made up of a body and two wicks, also known as shadows. The body represents the opening and closing prices, while the wicks represent the highest and lowest prices reached during that time period.
Candlestick patterns are formed by the arrangement of multiple candlesticks in a chart. They are created by the relationship between the opening, closing, high, and low prices of each candlestick. These patterns provide insights into market sentiment, trend direction, and potential price movements.
Types of Candlestick Patterns
There are dozens of candlestick patterns, but we’ll focus on some of the most commonly used ones, which are my favourites. The links go to more in-depth information on each.
1. Doji
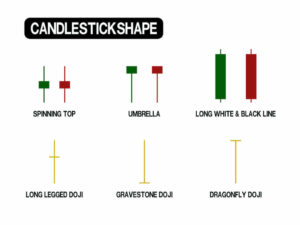
A doji is a candlestick pattern that signals indecision in the market. It occurs when the opening and closing prices are almost the same, resulting in a small body and long wicks. A doji indicates that buyers and sellers are evenly matched, and there is no clear trend.
There are four main types of doji:
- Neutral or Spinning Top doji: The opening and closing prices are almost the same, resulting in a small body and long wicks.
- Long-legged doji: The opening and closing prices are almost the same, but there are long wicks on both sides.
- Gravestone doji: The opening and closing prices are at the bottom of the candlestick, with a long wick above.
- Dragonfly doji: The opening and closing prices are at the top of the candlestick, with a long wick below.
 2. Hammer
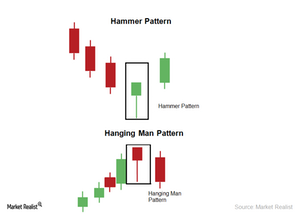
A hammer is a bullish candlestick pattern that occurs after a downtrend. It has a small body and a long wick at the bottom, indicating that buyers have stepped in to push prices back up. A hammer can be a sign of a potential trend reversal.
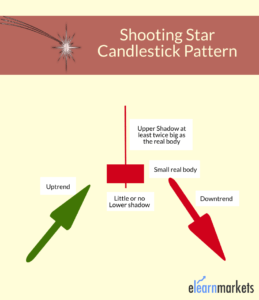 3. Shooting Star
A shooting star is a bearish candlestick pattern that occurs after an uptrend. It has a small body and a long wick at the top, indicating that sellers have stepped in to push prices back down. A shooting star can be a sign of a potential trend reversal.
4. Engulfing Pattern
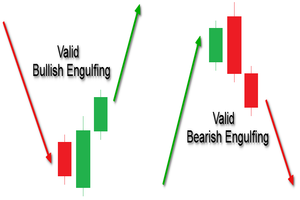
An engulfing pattern is a reversal candlestick pattern that occurs when a small candlestick is engulfed by a larger one. A bullish engulfing pattern occurs when a small bearish candlestick is followed by a larger bullish candlestick, indicating a potential trend reversal to the upside. A bearish engulfing pattern occurs when a small bullish candlestick is followed by a larger bearish candlestick, indicating a potential trend reversal to the downside.
5. Morning Star
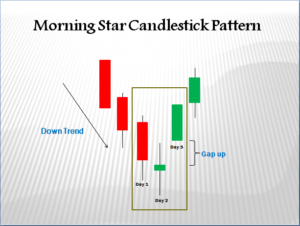 A morning star is a bullish candlestick pattern that occurs after a downtrend. It consists of three candlesticks:
- A long bearish candlestick
- A small bearish or neutral candlestick (Doji)
- A long bullish candlestick
The small candlestick in the middle is known as a star and indicates indecision in the market. The morning star pattern is a strong signal of a potential trend reversal to the upside.
6. Evening Star
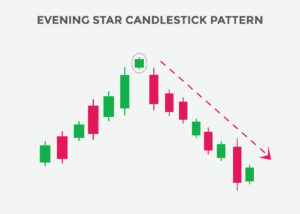 An evening star is a bearish candlestick pattern that occurs after an uptrend. It’s the opposite of a morning star and consists of three candlesticks:
- A long bullish candlestick
- A small bearish or neutral candlestick
- A long bearish candlestick
The evening star pattern is a strong signal of a potential trend reversal to the downside.
7. Harami
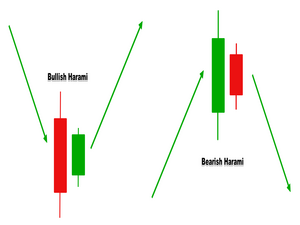 A harami is a reversal candlestick pattern that occurs when a small candlestick is contained within the body of the previous candlestick. A bullish harami occurs when a small bearish candlestick is followed by a larger bullish candlestick, indicating a potential trend reversal to the upside. A bearish harami occurs when a small bullish candlestick is followed by a larger bearish candlestick, indicating a potential trend reversal to the downside.
8. Tweezer
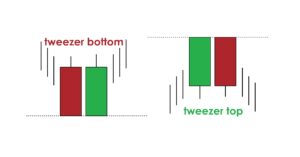 A tweezer is a reversal candlestick pattern that occurs when two candlesticks have the same high or low price. A bullish tweezer occurs when two candlesticks have the same low price, indicating support at that level. A bearish tweezer occurs when two candlesticks have the same high price, indicating resistance at that level.
9. Head and Shoulders and Variants
The double top and double bottom, also known as the head and shoulders pattern, is a reversal pattern that can signal a potential trend change. Let’s dive into what these patterns are and how to identify them.
Double Top
The double top is a bearish reversal pattern that occurs when an uptrend hits a resistance level twice before reversing. The pattern consists of two highs that are approximately equal, with a low in between them. The two highs are the 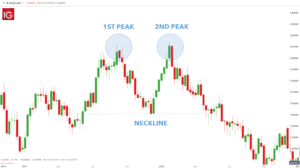 “tops,” and the low in between them is the “neckline.” Once the second high fails to break above the first, it signals that buyers are no longer able to push the price higher, and sellers may take control, causing a potential trend reversal.
To identify a double top, look for two highs that are almost identical in price, with a clear low point between them. The neckline is drawn by connecting the two low points, and once the price breaks below this level, it confirms the pattern.
Double Bottom
The double bottom is a bullish reversal pattern that occurs when a downtrend hits a support level twice before reversing. The pattern consists of two lows that are approximately equal, with a high in between them. The two lows are 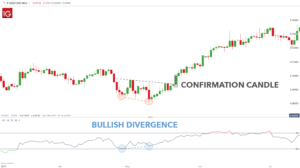 the “bottoms,” and the high in between them is the “neckline.” Once the second low fails to break below the first, it signals that sellers are no longer able to push the price lower, and buyers may take control, causing a potential trend reversal.
To identify a double bottom, look for two lows that are almost identical in price, with a clear high point between them. The neckline is drawn by connecting the two high points, and once the price breaks above this level, it confirms the pattern.
Head and Shoulders
The head and shoulders pattern is similar to the double top and double bottom patterns but consists of three peaks or valleys instead of two. The head and shoulders pattern is a bearish reversal pattern, with the inverse head and shoulders being a bullish reversal pattern. The head and shoulders pattern consists of three peaks, with the middle peak being the highest, and two valleys, with the middle valley being the lowest. The first and third peaks are known as the “shoulders,” and the middle peak is the “head.” The pattern is confirmed when the price breaks below the neckline, which is drawn by connecting the two valleys.
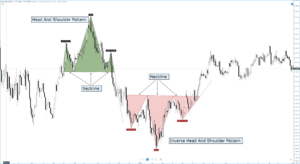
To identify a head and shoulders pattern, look for three peaks or valleys, with the middle peak or valley being the highest or lowest. The neckline is drawn by connecting the two valleys or peaks, and once the price breaks below this level for a bearish pattern or above for a bullish pattern, it confirms the pattern.
Tips for Using Candlestick Patterns
Candlestick patterns can be used alone or in combination with other technical indicators to identify potential trading opportunities. Here are some tips for using them effectively:
- Use multiple timeframes: Candlestick patterns can look different on different timeframes. It’s essential to analyze multiple timeframes to get a comprehensive picture of the market.
- Combine with other indicators: Candlestick patterns are not foolproof and should be used in combination with other technical indicators, such as moving averages or volume analysis.
- Look for confirmation: Candlestick patterns should be confirmed by other technical indicators or price action before making a trading decision.
- Practice with a demo account: Before using candlestick patterns in a live trading environment, practice with a demo account to get a feel for how they work and how to use them effectively.
Candlestick Patterns – Final Thoughts
Candlestick patterns are a valuable tool for traders to analyze price action and identify potential trading opportunities. There are dozens of candlestick patterns, each with its own unique characteristics and signals. By using candlestick patterns in combination with other technical indicators and analysis techniques, traders can gain a comprehensive understanding of the market and make informed decisions about buying and selling securities.
My favourite prop firms:
- Funded Trading Plus (Use Coupon Code DAR10 for 10% off)
- E8 Funding (Use Coupon Code REB8 for 8% off)
- MFF
- FTMO
If you like this post and would like to be notified of new posts, subscribe in the top right of this page. Please rate, share and comment!
Want to know which free indicators you should use with these candlestick patterns? Check out my article HERE.
